AI Conversation
Data Collection Techniques in Visual Research

In visual research, "photo elicitation" involves using photographs to evoke deeper responses and insights during interviews, as images can trigger memories and emotions that words alone might not access.
https://www.youtube.com/watch?v=q17s84ADGfA
observation

https://www.youtube.com/watch?v=n1wXdexQr_g
Observation in visual research involves systematically watching and recording behaviors, events, or artifacts to gather data. It provides rich, contextual insights and can be structured or unstructured. This technique captures real-time interactions and environments, offering a nuanced understanding of visual phenomena, often complementing other data collection methods like interviews or surveys.
content analysis

https://www.youtube.com/watch?v=i_5Isz9t8Hc
Content analysis in visual research involves systematically examining visual materials to interpret patterns and themes. This technique aids in understanding cultural and social contexts by coding and categorizing visual data. It enhances qualitative research by providing structured insights into visual content, complementing other data collection methods like interviews and observations.
visual elicitation

https://www.youtube.com/watch?v=tbZbySIni1M
Visual elicitation in data collection involves using images, videos, or visual prompts to stimulate discussion and gather insights in visual research. This technique enhances participant engagement, aids memory recall, and facilitates deeper understanding by allowing participants to express thoughts and emotions that might be difficult to articulate verbally.
ethnography
https://www.youtube.com/watch?v=_c1SUHTG6B8
Ethnography in visual research involves immersive observation and documentation of cultural practices through visual means, such as photography and video. It emphasizes understanding participants' perspectives and contexts, providing rich, qualitative insights. This method captures the nuanced interplay between visual elements and social dynamics, enhancing the depth of data collected.
surveys
https://www.youtube.com/watch?v=9cuOyAR-Y9I
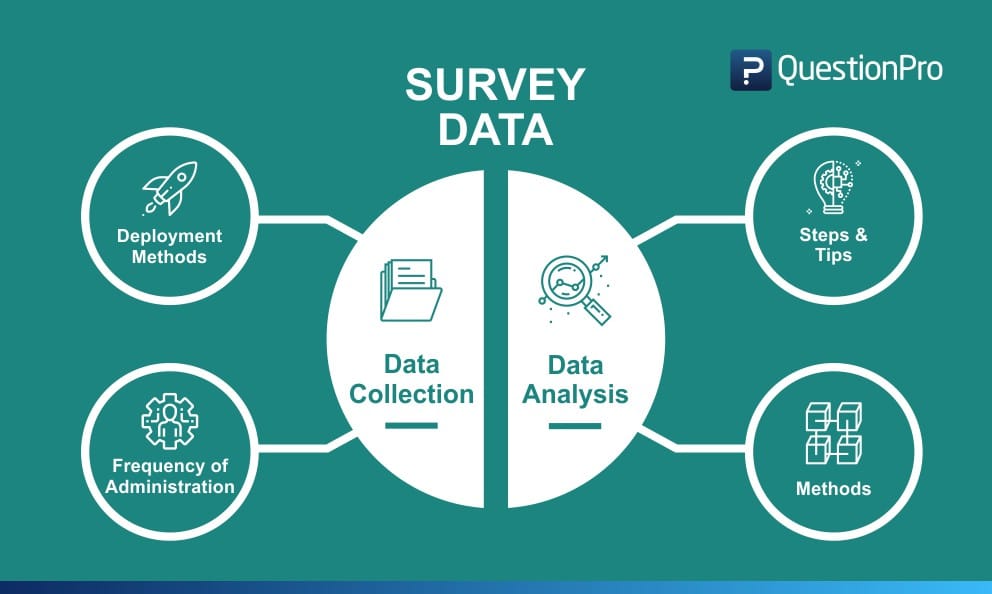
Surveys in visual research gather quantitative and qualitative data by soliciting participant responses to structured questions. They enable researchers to capture perceptions, preferences, and interpretations of visual materials. As a data collection technique, surveys offer scalability and standardization, facilitating the analysis of trends and patterns in visual studies.
photography
https://www.youtube.com/watch?v=1QgL_aPPCpM

Photography in visual research serves as a powerful data collection technique, capturing detailed, contextual information. It enables researchers to document environments, behaviors, and interactions, providing rich visual evidence. This method enhances qualitative analysis, offering insights into cultural and social dynamics, while preserving authenticity and facilitating deeper understanding of studied phenomena.
video recording
https://www.youtube.com/watch?v=1QgL_aPPCpM

Video recording is a valuable data collection technique in visual research, capturing dynamic, real-time interactions and environments. It allows for detailed analysis of non-verbal cues, context, and behavior over time. This method enhances data richness, enabling researchers to revisit and reanalyze footage for deeper insights and comprehensive understanding.
archival research
https://www.youtube.com/watch?v=rC02fDoKLps
Archival research in visual research involves analyzing existing visual materials, such as photographs, films, and artworks, to gather historical and contextual data. This technique provides insights into cultural, social, and artistic trends, enabling researchers to explore visual narratives and patterns without the need for new data collection.
AI Report
Essay
### Data Collection Techniques in Visual Research
Visual research is an expansive field that utilizes images and other visual media to gather data and convey findings. The techniques employed in data collection are crucial as they shape the insights derived from visual materials. This essay explores three primary data collection techniques in visual research: photography, video recording, and visual ethnography. Each method offers unique advantages and challenges, influencing how researchers interpret and analyze visual data.
Photography is one of the most prevalent techniques in visual research. It allows researchers to capture real-life scenarios and document phenomena as they occur in their natural settings. Photographic data can be analyzed qualitatively, offering insights into contexts, behaviors, and interactions (Rose, 2016). Moreover, photography can serve as a powerful tool for engaging participants and eliciting emotional responses. However, researchers must remain aware of ethical considerations, such as obtaining consent and ensuring that the subjects are comfortable with being photographed (Baker, 2016). Additionally, the interpretation of photographs can be subjective, leading to potential biases in analysis.
Video recording is another effective data collection technique in visual research. It offers a dynamic means of capturing events over time, allowing researchers to analyze movements, interactions, and changes in behavior (Kress & Van Leeuwen, 2006). Video data can be particularly beneficial in studies focused on communication, performance, or social interactions, providing a richer context than static images alone. However, the complexity of analyzing video footage can be a challenge. Researchers must be equipped with the right tools and skills to dissect and interpret the various layers of information captured in the recordings (Heath, Hindmarsh, & Luff, 2010). Furthermore, the presence of a camera can alter participant behavior, an effect known as the Hawthorne effect, which researchers must account for in their analysis.
Visual ethnography combines elements of visual research with ethnographic methods, offering a holistic approach to data collection. This technique involves the immersive study of cultures and communities through visual means, such as photographs, videos, and participatory visual methods (Pink, 2007). By engaging with participants in their environments, researchers can gather rich, contextual data that reveals the intricacies of social life. Visual ethnography emphasizes the co-construction of knowledge, where participants are active contributors to the research process. However, this method can be time-consuming and necessitates a deep commitment from researchers to build trust and rapport within the communities studied (Margolis & Pauwels, 2011).
In conclusion, data collection techniques in visual research, including photography, video recording, and visual ethnography, each offer distinct benefits and challenges. While photography provides a snapshot of moments, video captures dynamic interactions, and visual ethnography fosters a deeper understanding of cultural contexts. Researchers must carefully consider the ethical implications and potential biases associated with each method to ensure the integrity of their findings. Ultimately, the choice of data collection technique should align with the research objectives and the nature of the visual phenomena under investigation.
### References
Baker, S. (2016). *Photography and research: A guide for visual researchers*. Routledge.
Heath, C., Hindmarsh, J., & Luff, P. (2010). *Video in qualitative research: Analyzing social interaction in everyday life*. SAGE Publications.
Kress, G., & Van Leeuwen, T. (2006). *Reading images: The grammar of visual design* (2nd ed.). Routledge.
Margolis, E., & Pauwels, L. (2011). *The Sage handbook of visual research methods*. SAGE Publications.
Pink, S. (2007). *Doing visual ethnography*. SAGE Publications.
Rose, G. (2016). *Visual methodologies: An introduction to researching with visual materials* (3rd ed.). SAGE Publications.
Lesson Plan
### Lesson Plan: Data Collection Techniques in Visual Research
**Grade Level:** Technical Vocational Students
**Subject:** Visual Research / Data Collection Techniques
**Duration:** 2 hours
**Materials Needed:**
- Whiteboard and markers
- Projector and screen
- Printed handouts of key concepts
- Sample visual research materials (images, videos, etc.)
- Laptops or tablets with internet access
- Survey tools (Google Forms, SurveyMonkey)
- Example visual research projects
---
#### Objectives:
By the end of the lesson, students will be able to:
1. Understand different data collection techniques in visual research.
2. Discuss how these techniques work and their applications.
3. Learn how to maintain data integrity throughout the collection process.
4. Conduct a simple visual research project using appropriate data collection methods.
---
### Lesson Outline
#### Introduction (15 minutes)
- **Ice Breaker Activity:** Ask students to share any experiences they have had with visual data (e.g., photography, infographics, videos).
- **Overview of Visual Research:** Briefly explain what visual research is and its importance in various fields such as marketing, design, and social sciences.
#### Direct Instruction (30 minutes)
- **Presentation on Data Collection Techniques:**
- **Qualitative Techniques:**
- Interviews (structured and unstructured)
- Focus groups
- Observational methods
- **Quantitative Techniques:**
- Surveys (online and paper-based)
- Experiments
- Content analysis
- **Mixed Methods:** Combining qualitative and quantitative approaches
- Discuss the benefits and limitations of each technique.
#### Group Activity (30 minutes)
- **Group Work:** Divide students into small groups. Assign each group a specific data collection technique.
- **Task:** Research the assigned technique using internet resources and prepare a brief presentation.
- Groups should cover:
- How the technique works
- Examples of when it is used
- Pros and cons
- Each group presents their findings (5 minutes per group).
#### Practical Application (30 minutes)
- **Hands-On Activity:**
- In their groups, students will design a simple visual research project using the technique they studied.
- They should:
- Define a research question
- Choose the appropriate data collection technique
- Develop a plan for data collection (e.g., survey questions or interview prompts)
- Encourage students to think about how they will maintain data integrity and confidentiality during their research.
#### Wrap-Up (15 minutes)
- **Class Discussion:**
- Discuss the importance of maintaining data integrity and ethical considerations in visual research.
- Ask groups to share their project ideas and how they plan to maintain data integrity.
- **Q&A Session:** Open the floor for any questions students might have regarding data collection techniques.
#### Homework Assignment
- Each student will select one data collection technique and write a one-page reflection on how they would apply it to a real-world scenario of their choice.
---
### Assessment
- Participation in group activities and presentations.
- Evaluation of the group project design for clarity and application of the data collection technique.
- Homework reflection will be assessed for understanding and application of concepts learned in class.
---
### Additional Resources
- Recommended readings on visual research methodology.
- Online tutorials on using survey tools.
- Access to articles and case studies that illustrate successful visual research projects.
This lesson plan aims to engage technical vocational students in understanding and applying data collection techniques in visual research, preparing them for real-world applications in their future careers.
Class Syllabus Outline
# Syllabus for Data Collection Techniques in Visual Research
## Course Information
- **Course Title:** Data Collection Techniques in Visual Research
- **Course Code:** VRS 301
- **Semester:** Fall 2023
- **Credits:** 3
- **Instructor:** [Instructor Name]
- **Email:** [Instructor Email]
- **Office Hours:** [Days and Times]
- **Location:** [Classroom/Online Platform]
---
## Course Description
This course provides an in-depth exploration of data collection techniques in the field of visual research. Students will learn various methodologies for gathering visual data, including qualitative and quantitative approaches. The course will emphasize hands-on experience and critical analysis of visual research tools and techniques.
---
## Course Objectives
By the end of this course, students will be able to:
1. Identify and describe various data collection techniques used in visual research.
2. Evaluate the strengths and weaknesses of different methodologies.
3. Design a research project that incorporates appropriate data collection techniques.
4. Analyze and interpret visual data collected through various methods.
5. Communicate findings effectively through visual presentations and written reports.
---
## Required Texts and Materials
1. **Textbook:**
- Rose, G. (2016). *Visual Methodologies: An Introduction to Researching with Visual Materials.* Sage Publications.
2. **Supplementary Readings:**
- Articles and case studies provided by the instructor throughout the course.
3. **Materials:**
- Access to a camera (DSLR, smartphone, or equivalent).
- Access to software for data analysis and presentation (e.g., Excel, SPSS, Adobe Creative Suite).
---
## Course Outline
### Week 1: Introduction to Visual Research
- Overview of visual research
- Importance of data collection in visual studies
- Introduction to key concepts and terminology
### Week 2: Qualitative vs. Quantitative Data
- Differences between qualitative and quantitative research
- When to use each method in visual research
### Week 3: Observational Techniques
- Participant observation
- Non-participant observation
- Ethical considerations in observational research
### Week 4: Surveys and Questionnaires
- Designing effective surveys
- Types of survey questions
- Analyzing survey data
### Week 5: Interviews and Focus Groups
- Conducting interviews in visual research
- Organizing and analyzing focus group discussions
- Best practices for qualitative data collection
### Week 6: Visual Ethnography
- Introduction to visual ethnography
- Techniques for capturing visual narratives
- Case studies of visual ethnography
### Week 7: Photography as a Research Tool
- Principles of visual storytelling
- Ethical considerations in visual documentation
- Practical workshop on photography techniques
### Week 8: Digital Data Collection
- Using social media and online platforms for data collection
- Analyzing digital visual data
- Tools for digital data analysis
### Week 9: Data Analysis Techniques
- Coding and categorizing visual data
- Statistical analysis for quantitative visual data
- Visualization techniques for presenting data
### Week 10: Presenting Visual Research
- Best practices for creating visual presentations
- Communicating findings effectively
- Peer review of presentations
### Week 11: Case Studies in Visual Research
- Review of successful visual research projects
- Group discussions on methodology and findings
### Week 12: Final Projects
- Presentation of individual research projects
- Feedback and discussion
---
## Assessment and Grading
- **Participation:** 10%
- **Weekly Assignments:** 30%
- **Midterm Project:** 20%
- **Final Project:** 40%
---
## Course Policies
- **Attendance:** Regular attendance is expected. More than two unexcused absences may impact your final grade.
- **Late Work:** Assignments submitted late will incur a penalty unless prior arrangements are made with the instructor.
- **Academic Integrity:** Students are expected to adhere to the institution's academic integrity policy. Plagiarism and cheating will not be tolerated.
---
## Resources
- **Writing Center:** [Writing Center Contact Info]
- **Library Resources:** Access to databases and visual research materials.
- **Online Forums:** [Online Platform for Discussions and Resources]
---
## Important Dates
- **Start Date:** [Start Date]
- **Midterm Project Due:** [Midterm Due Date]
- **Final Project Due:** [Final Due Date]
- **Last Day to Withdraw:** [Withdrawal Date]
---
**Instructor Contact Information:**
For any questions or concerns, please reach out via email or during office hours.
---
### Note
This syllabus is subject to change based on the instructor's discretion and the needs of the class. Students will be informed of any changes in a timely manner.
Learning Objectives
### Learning Objectives for Data Collection Techniques in Visual Research Course
By the end of this course, students will be able to:
1. **Understand Fundamental Concepts**
Explain the key concepts and principles of visual research and data collection techniques, including qualitative and quantitative methods.
2. **Identify Appropriate Techniques**
Evaluate and select appropriate data collection techniques for various visual research projects, including surveys, interviews, observations, and content analysis.
3. **Design Data Collection Instruments**
Develop effective data collection instruments (such as questionnaires, interview guides, and observation checklists) tailored to specific research questions in visual contexts.
4. **Implement Data Collection Procedures**
Execute data collection procedures using selected techniques, ensuring adherence to ethical standards and best practices in research.
5. **Analyze Collected Data**
Interpret and analyze the data collected through visual research methods, employing both qualitative and quantitative analysis techniques.
6. **Utilize Visual Tools**
Utilize various visual tools and technologies (e.g., photography, videography, and graphic design software) to enhance data collection and presentation.
7. **Reflect on Data Collection Process**
Critically reflect on the data collection process, identifying challenges encountered and strategies for overcoming them in future research endeavors.
8. **Communicate Findings Effectively**
Present research findings clearly and effectively using visual aids, ensuring that the results are accessible and understandable to a diverse audience.
9. **Collaborate on Research Projects**
Work collaboratively in teams to plan, execute, and present a visual research project, demonstrating effective teamwork and communication skills.
10. **Explore Emerging Trends**
Investigate and discuss emerging trends and technologies in data collection for visual research, understanding their potential impacts on the field.
These objectives aim to equip students with the necessary skills and knowledge to effectively collect and analyze data in visual research contexts, preparing them for future careers in technical fields.
Quiz Questions
Sure! Here are five multiple-choice questions focused on data collection techniques in visual research, along with their answers:
### Question 1:
Which of the following is a commonly used method for collecting visual data in research?
A) Surveys
B) Interviews
C) Photography
D) Focus Groups
**Answer:** C) Photography
---
### Question 2:
In visual research, what is the primary purpose of using video recordings?
A) To create written reports
B) To capture dynamic interactions and behaviors
C) To conduct surveys
D) To analyze numerical data
**Answer:** B) To capture dynamic interactions and behaviors
---
### Question 3:
What type of sampling method is often used in visual ethnography to ensure diversity in visual data collection?
A) Random Sampling
B) Convenience Sampling
C) Purposive Sampling
D) Systematic Sampling
**Answer:** C) Purposive Sampling
---
### Question 4:
Which of the following data collection techniques involves participants creating their own visual content as part of the research process?
A) Photo elicitation
B) Content analysis
C) Case study
D) Longitudinal study
**Answer:** A) Photo elicitation
---
### Question 5:
What is the main advantage of using digital tools for data collection in visual research?
A) They eliminate the need for ethical considerations
B) They allow for real-time data analysis and sharing
C) They reduce the costs of printing materials
D) They guarantee accurate results
**Answer:** B) They allow for real-time data analysis and sharing
---
Feel free to use these questions for educational purposes or assessments related to visual research!